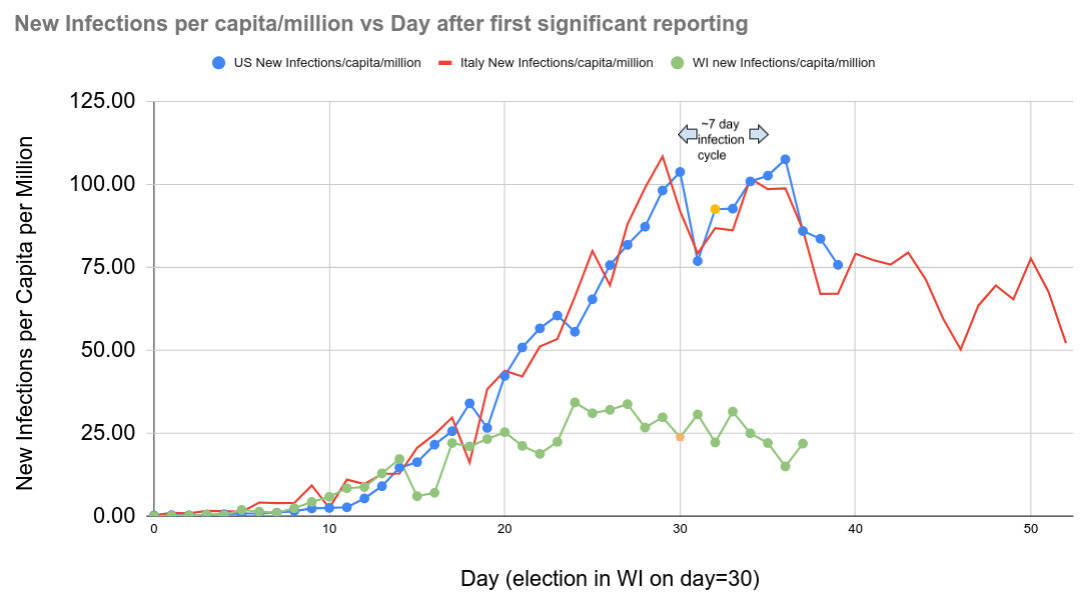
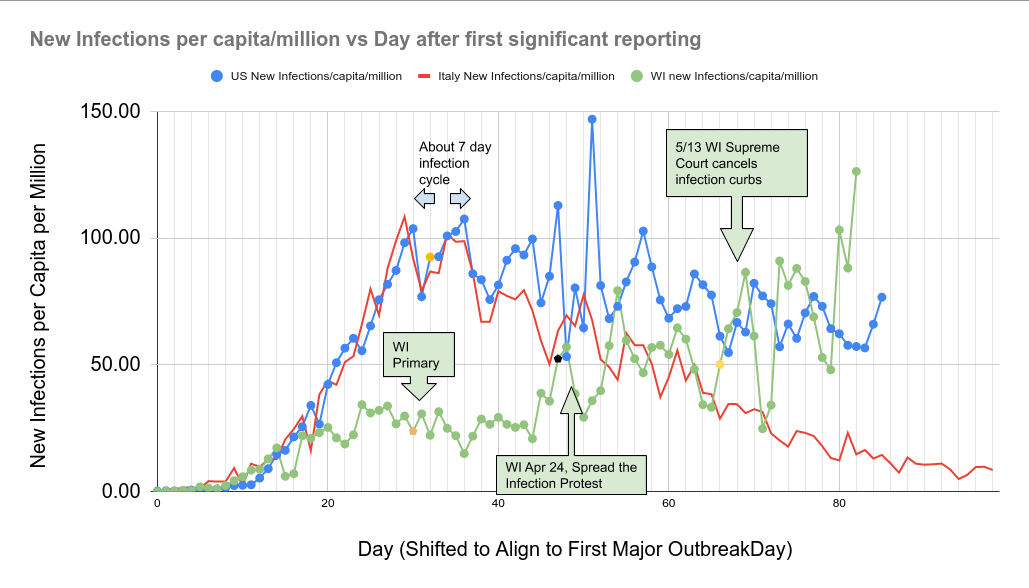
Update 5: WI shoots past US peak rate
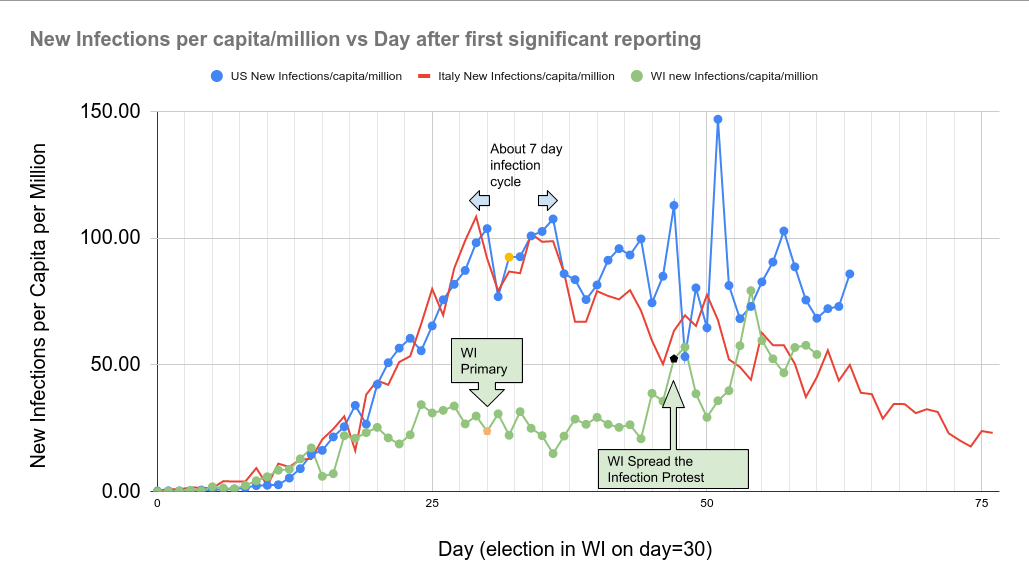
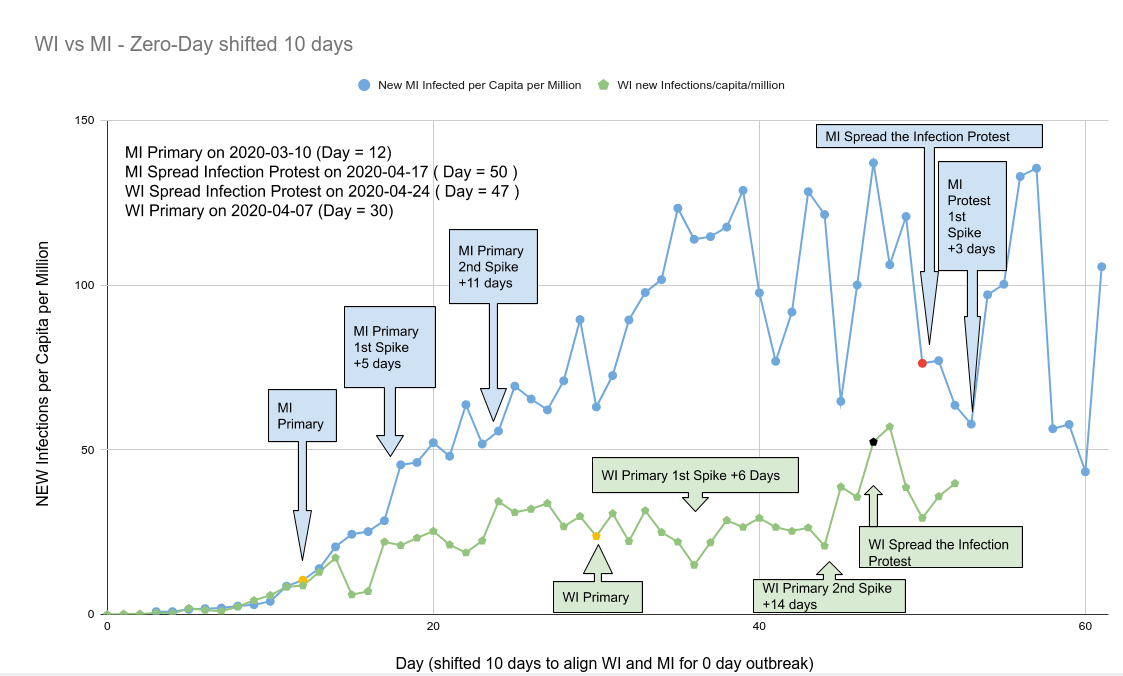
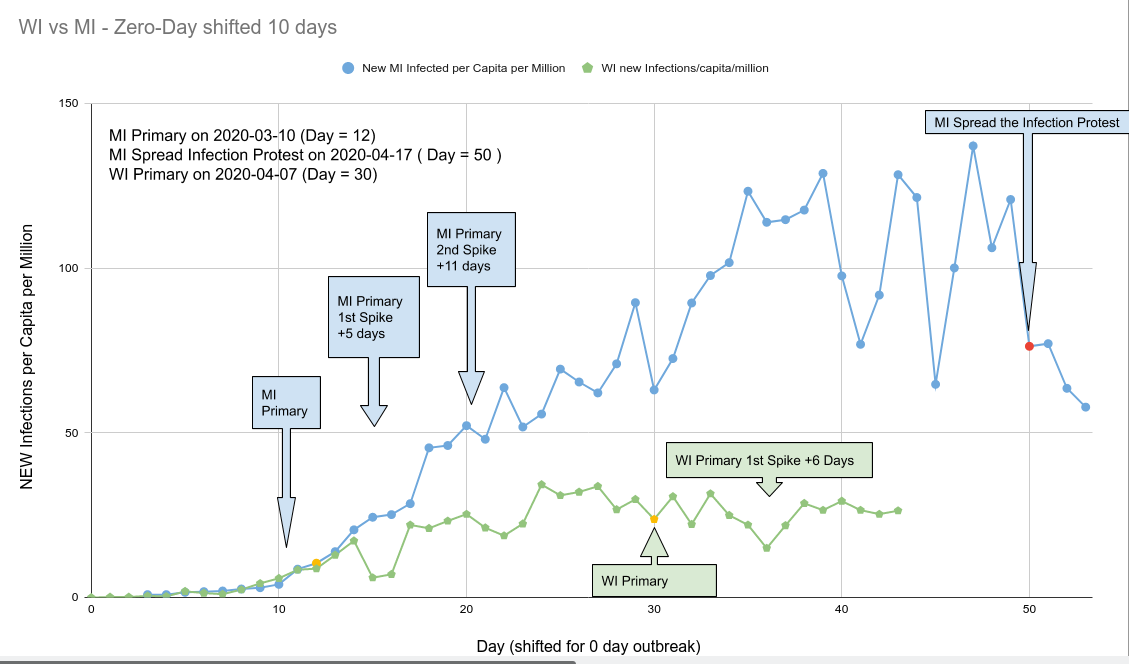
2020-05-30: While Italy has the standard exponential growth and standard decay of a pandemic, in WI you can see the effects of the lawsuits and protests that ended the curbs weeks too early. Each event has a spike at about 3-7 days after the event and a second one 10-14 days after the event.
Tags
- Read more about Update 5: WI shoots past US peak rate
- Log in to post comments