You can see the results of the spread the infection protest in MI in the graph below. The end effect that MI has been pushed back to peak infection rate levels. As you see in the graph - since MI is 10 days ahead of WI, one would expect a similar peak after the WI spread the infection protest on 2020-04-24
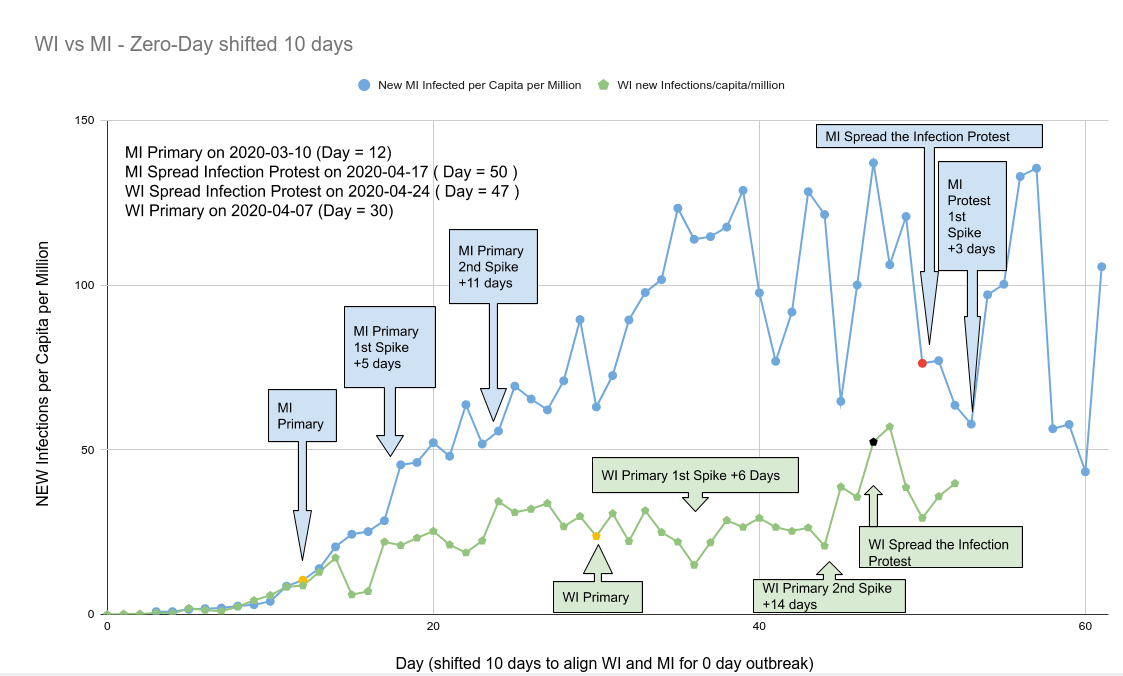
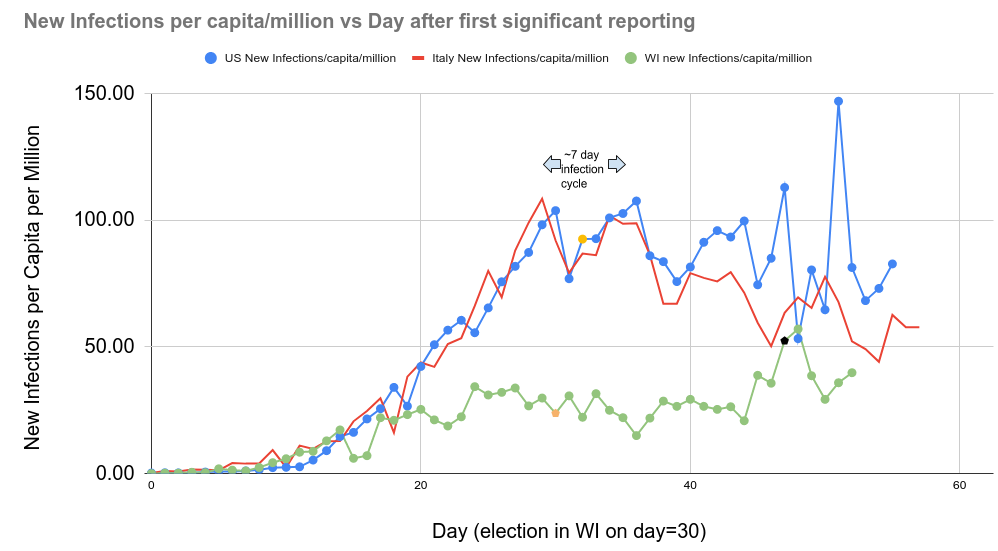
Contrast the new MI peak after their spread the infection protest and and two new peaks in WI after the WI primary to what a regular exponential growth and natural decay pattern looks like which you see in in other areas of the world. WI and MI would have been trending down now for two weeks with WI down to nearly eradication levels in the absence of these spikes. The protest and primary created a significant upward deviation in creating many new infections and deaths instead of what one would have had in the absence of these mass public gatherings.
This page is an update from /covid19/wi_vs_world_update1
- Log in to post comments