


Qemu/KVM Backups: Optimization of Images and Network Traffic.
A few tricks to optimize backups for QEMU/KVM virtual machines.
A few tricks to optimize backups for QEMU/KVM virtual machines.
The phrase "many eyes gives better security" works in the open source world extremely well ... as long as you can make sure that all parts of the security model are available for independent review.
As soon as you hide any part of that, the "many eyes" security model no longer applies. Docker hides part of that process when they create the docker image and do not make available the vendor image from which the docker image was created.
I've been finding that physics simulations that tax a GPU are very taxing on a virtual system in KVM when you don't have a GPU passthrough.
NVidia created their own Docker image that allows this seamlessly. I worry though that the Docker infrastructure is to be cavalier about the signing process for what gets to be part of an official image. For example Nvidia does not sign their docker images.
https://gitlab.com/nvidia/container-images/cuda/-/issues/108#note_502102151
The power of Open Source technology is the ability to delve deeply into the guts of a released project to see what's happening behind the scenes. That usually requires not just downloading the completed packages and looking at the code, but replicating the process used to create the packages and seeing if you get the same thing on an independent system.
Ubuntu does an excellent job of setting a trust chain that can be tracked all the way down to the original code both with hashes and signatures. You can follow the base code signature and hashes all the way up to the final signed/hashed distribution. How about docker?
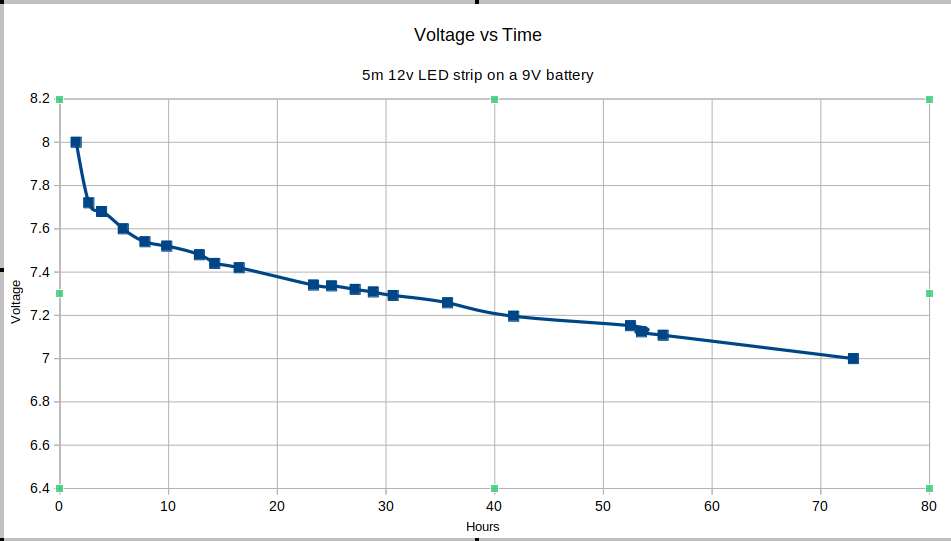
A WERNER 9V alkaline battery on a 5m string of 12V IP68 LED lights.
Tests to see if the battery + lights would work well for lighting up a buoy at night for a moonlit race and be completely powered by a 9V battery.
Initial Voltage of Battery = 9.7 V
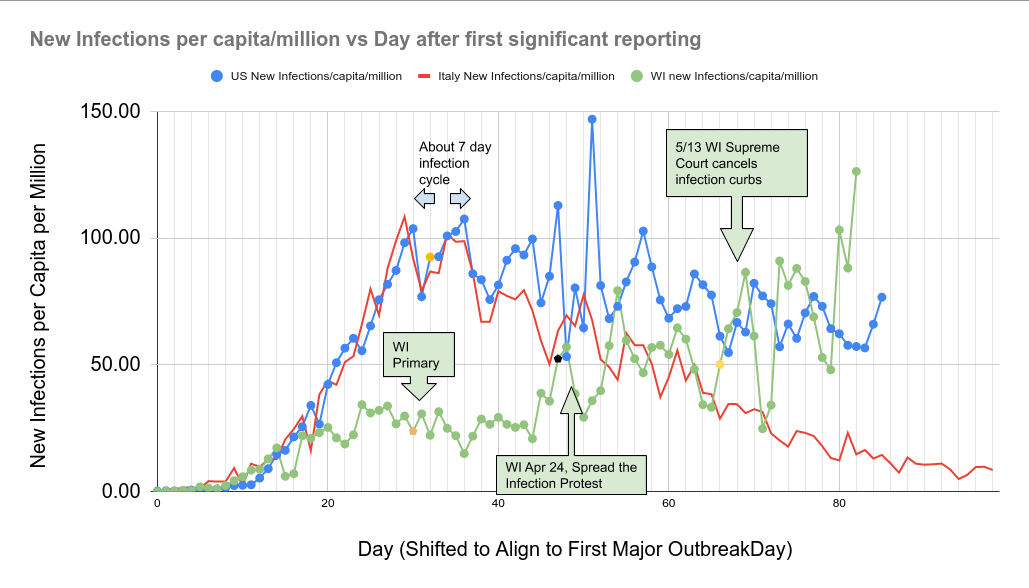
Since we've seen the 7 +/- 2 day lag in spikes in Italy and WIsconsin it's interesting to see if you can see those same patterns on a county by county basis. A good comparison is Racine vs Dane Counties.
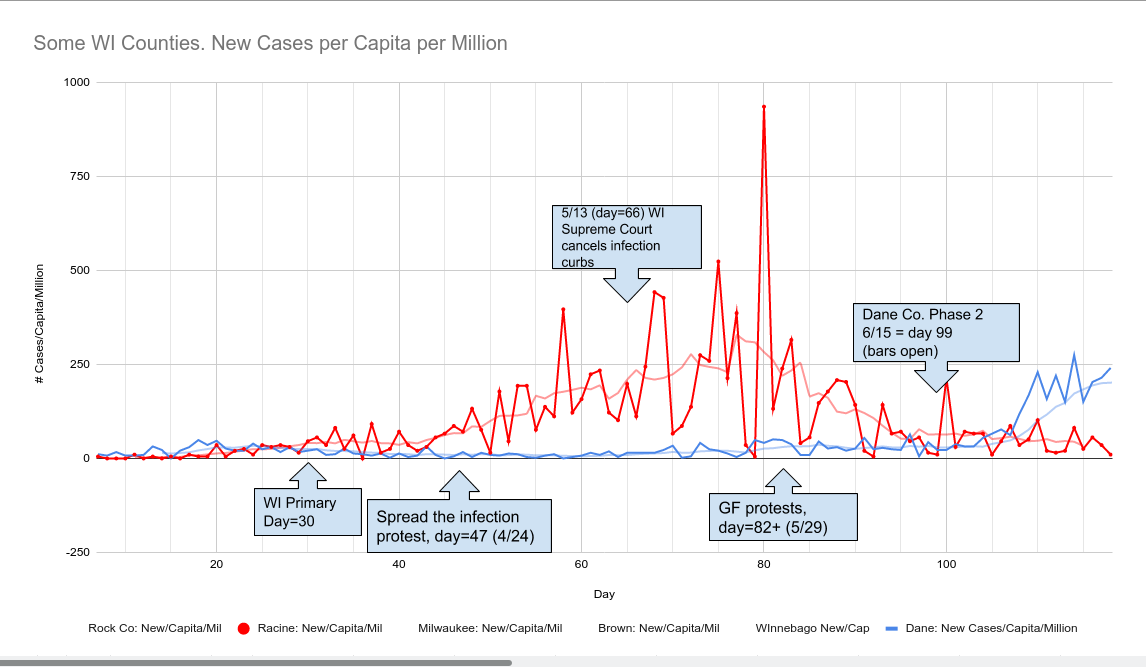
2020-05-30: While Italy has the standard exponential growth and standard decay of a pandemic, in WI you can see the effects of the lawsuits and protests that ended the curbs weeks too early. Each event has a spike at about 3-7 days after the event and a second one 10-14 days after the event.
2020-05-13: The science of spreading disease states that the more exposure to a virus, the more likely you are to be infected. And we see that clearly in COVID-19 as those counties most likely to participate in the "Spread the infection" protests became those counties with the largest increase in per-capita infections. 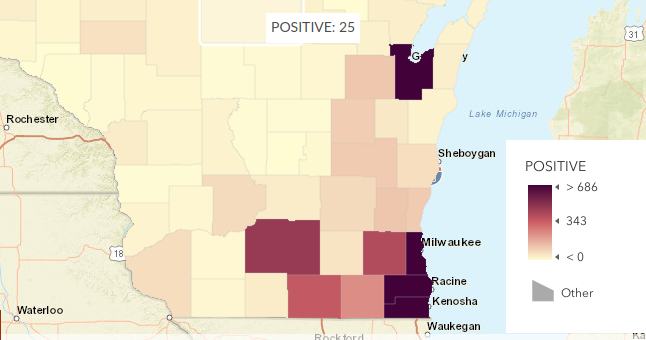
Paxton ported to drupal by DropThemes.in